One of the most common questions we hear at ProGreen Solar is: "What about the energy and carbon used to make the panels? Does solar really come out ahead?" It is a fair and important question that deserves a thorough, data-driven answer.
The short answer is yes — overwhelmingly yes. Solar panels repay their manufacturing carbon footprint in one to three years, then generate 25 or more years of essentially carbon-free electricity. But the long answer is more interesting and reveals just how dramatically solar's environmental advantage has grown as manufacturing has improved.
This guide walks through the complete lifecycle of a solar panel — from sand mine to retirement — accounting for every gram of carbon dioxide along the way.
The Solar Panel Lifecycle
Every product has a lifecycle with environmental impacts at each stage. For solar panels, the lifecycle includes:
- Raw material extraction — Mining silicon, aluminum, copper, silver, and other materials
- Material processing — Refining metallurgical-grade silicon into solar-grade polysilicon
- Cell and module manufacturing — Turning processed materials into functioning solar cells and assembling them into panels
- Transportation — Shipping panels from factories (often in Asia) to installation sites
- Installation — Mounting hardware, inverters, wiring, and construction activity
- Operation — 25 to 35 years of electricity generation (with minimal environmental impact)
- End of life — Decommissioning, recycling, or disposal
Let us examine the carbon emissions at each stage.
Stage 1: Raw Material Extraction
Solar panels are primarily made from:
- Silicon (from quartz sand) — the semiconductor material in solar cells
- Aluminum — for frames and mounting structures
- Glass — for the front protective layer
- Copper — for wiring and connections
- Silver — for cell contacts (small quantities)
- Ethylene-vinyl acetate (EVA) — for encapsulation
- Backsheet materials — for rear protection
Mining and extracting these raw materials generates carbon emissions from diesel-powered equipment, transportation, and processing energy. The total extraction footprint for a typical 400-watt panel is approximately 20 to 40 kg of CO2 equivalent.
For context, mining and processing the materials for solar panels is far less environmentally disruptive than the continuous extraction of coal, natural gas, or uranium required to fuel conventional power plants. Solar requires a one-time material input for decades of energy production; fossil fuels require continuous extraction.
Stage 2: Material Processing
The most energy-intensive step in solar manufacturing is purifying silicon. Metallurgical-grade silicon (98 percent pure) must be refined to solar-grade polysilicon (99.9999 percent pure — also called "six nines" purity) through the Siemens process or fluidized bed reactor process.
The Siemens process requires significant electrical energy — approximately 60 to 120 kWh per kilogram of polysilicon. Since each 400-watt panel uses about 0.7 to 0.9 kg of polysilicon, the silicon purification step alone consumes 42 to 108 kWh of electricity.
The carbon intensity of this electricity is critical. Polysilicon factories powered by hydroelectric or renewable energy have dramatically lower carbon footprints than those powered by coal. This is why the geographic location of manufacturing matters enormously:
| Manufacturing Region | Grid Carbon Intensity | Polysilicon Carbon Footprint |
|---|---|---|
| China (Yunnan, Sichuan — hydro-heavy) | 200-300 g CO2/kWh | 25-50 kg CO2 per panel |
| China (Xinjiang, Inner Mongolia — coal-heavy) | 700-900 g CO2/kWh | 80-150 kg CO2 per panel |
| United States | 350-450 g CO2/kWh | 40-70 kg CO2 per panel |
| Europe | 250-400 g CO2/kWh | 30-55 kg CO2 per panel |
| South Korea | 400-500 g CO2/kWh | 45-75 kg CO2 per panel |
The solar industry has been rapidly shifting production toward regions with cleaner grids. The majority of new polysilicon capacity coming online uses hydroelectric power, which reduces the manufacturing carbon footprint by 40 to 70 percent compared to coal-powered facilities.
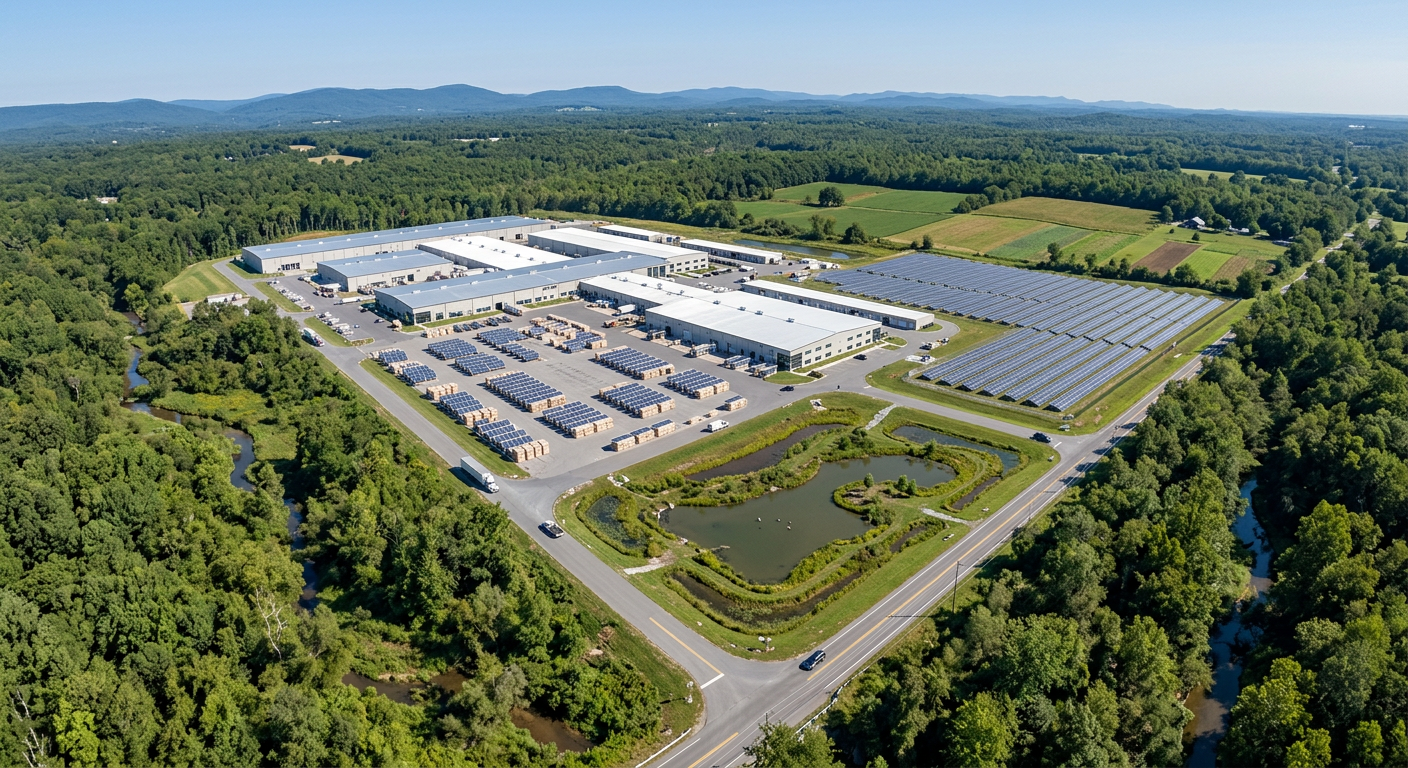
Stage 3: Cell and Module Manufacturing
After polysilicon is produced, it undergoes several more steps:
- Ingot growing — Polysilicon is melted and solidified into monocrystalline or polycrystalline ingots
- Wafer slicing — Ingots are sliced into thin wafers (150 to 180 micrometers thick)
- Cell processing — Wafers are treated with dopants, anti-reflective coatings, and metal contacts
- Module assembly — Cells are soldered together, encapsulated in EVA, placed behind glass, framed in aluminum, and wired
These steps add approximately 30 to 60 kg CO2 per panel, depending on the energy source of the factory and the specific technology (PERC, TOPCon, heterojunction, etc.).
Total Manufacturing Carbon Footprint
Combining all stages, the total cradle-to-gate carbon footprint for a modern 400-watt solar panel ranges from:
- Low estimate: 300 to 400 kg CO2 equivalent (hydro-powered manufacturing)
- Mid estimate: 400 to 600 kg CO2 equivalent (mixed grid manufacturing)
- High estimate: 600 to 900 kg CO2 equivalent (coal-heavy grid manufacturing)
The industry average has dropped from approximately 1,200 kg CO2 per panel in 2010 to roughly 450 to 550 kg CO2 per panel in 2026 — a decline of more than 50 percent in 15 years.
Stage 4: Transportation
Shipping solar panels from Asian factories to Colorado adds a relatively small carbon footprint:
- Ocean shipping from China to a US port: approximately 10 to 15 kg CO2 per panel
- Ground transportation to Colorado: approximately 3 to 5 kg CO2 per panel
Total transportation: 13 to 20 kg CO2 per panel — roughly 3 to 4 percent of the total lifecycle footprint.
Domestic manufacturing (growing rapidly under the Inflation Reduction Act) would reduce this to near zero for the ocean shipping component.
Stage 5: Installation
Installation activities — truck rolls, equipment operation, construction materials — add approximately 10 to 20 kg CO2 per panel. This includes the embodied carbon in mounting hardware (aluminum rails, steel brackets), inverters, and wiring.
Inverters and balance-of-system equipment add their own manufacturing footprint of roughly 50 to 100 kg CO2 for a typical residential system (amortized across all panels, this adds about 5 to 10 kg per panel).
Stage 6: Operation — 25 to 35 Years of Clean Energy
Here is where the math turns overwhelmingly in solar's favor. Once installed, a solar panel generates electricity with zero direct carbon emissions for its entire operational life.
In Colorado, a 400-watt panel produces approximately 600 to 680 kWh per year (thanks to our excellent solar resource). Over a 30-year lifespan with 0.35 percent annual degradation, a single panel produces approximately 18,000 to 20,000 kWh of electricity.
Each kWh of solar electricity displaces grid electricity that would otherwise be generated. Colorado's grid emits approximately 0.45 to 0.55 kg CO2 per kWh (Xcel Energy's 2024 reported carbon intensity, trending downward as they add renewables).
Carbon displaced by one panel over 30 years:
- Conservative: 18,000 kWh x 0.45 kg/kWh = 8,100 kg CO2
- Mid estimate: 19,000 kWh x 0.50 kg/kWh = 9,500 kg CO2
- Optimistic: 20,000 kWh x 0.55 kg/kWh = 11,000 kg CO2
Total lifecycle carbon footprint of one panel: 450 to 600 kg CO2
Net carbon savings over 30 years: 7,500 to 10,400 kg CO2 per panel
That is a 15 to 20 times return on the carbon investment. Every kilogram of CO2 emitted during manufacturing is repaid 15 to 20 times over through clean electricity generation.
Energy Payback Time
The energy payback time (EPBT) measures how long a solar panel must operate to generate the same amount of energy that was used to manufacture it. This is a different metric from carbon payback but equally important.
Current EPBT for crystalline silicon panels:
| Location | Solar Irradiance | EPBT |
|---|---|---|
| Colorado (Denver) | 1,800-2,000 kWh/m²/year | 1.0-1.5 years |
| Southern US | 1,900-2,200 kWh/m²/year | 0.8-1.2 years |
| Northern US | 1,300-1,500 kWh/m²/year | 1.5-2.5 years |
| Northern Europe | 900-1,200 kWh/m²/year | 2.0-3.0 years |
In Colorado, the energy payback time is approximately 1.0 to 1.5 years. After that, the panel generates net-positive clean energy for the remaining 28 to 34 years of its operational life. That is a net energy return of 20 to 30 times the energy invested — one of the highest energy returns on investment of any electricity generation technology.
Carbon Payback Time
Carbon payback time measures how long the panel must operate for its clean electricity generation to offset all lifecycle carbon emissions (manufacturing, transportation, installation, and eventual decommissioning).
Carbon payback in Colorado: 1.5 to 2.5 years
This means that within two to three years of installation, your solar panels have repaid their entire carbon debt. Every year after that is pure carbon savings — roughly 300 to 500 kg CO2 per panel per year, every year, for decades.
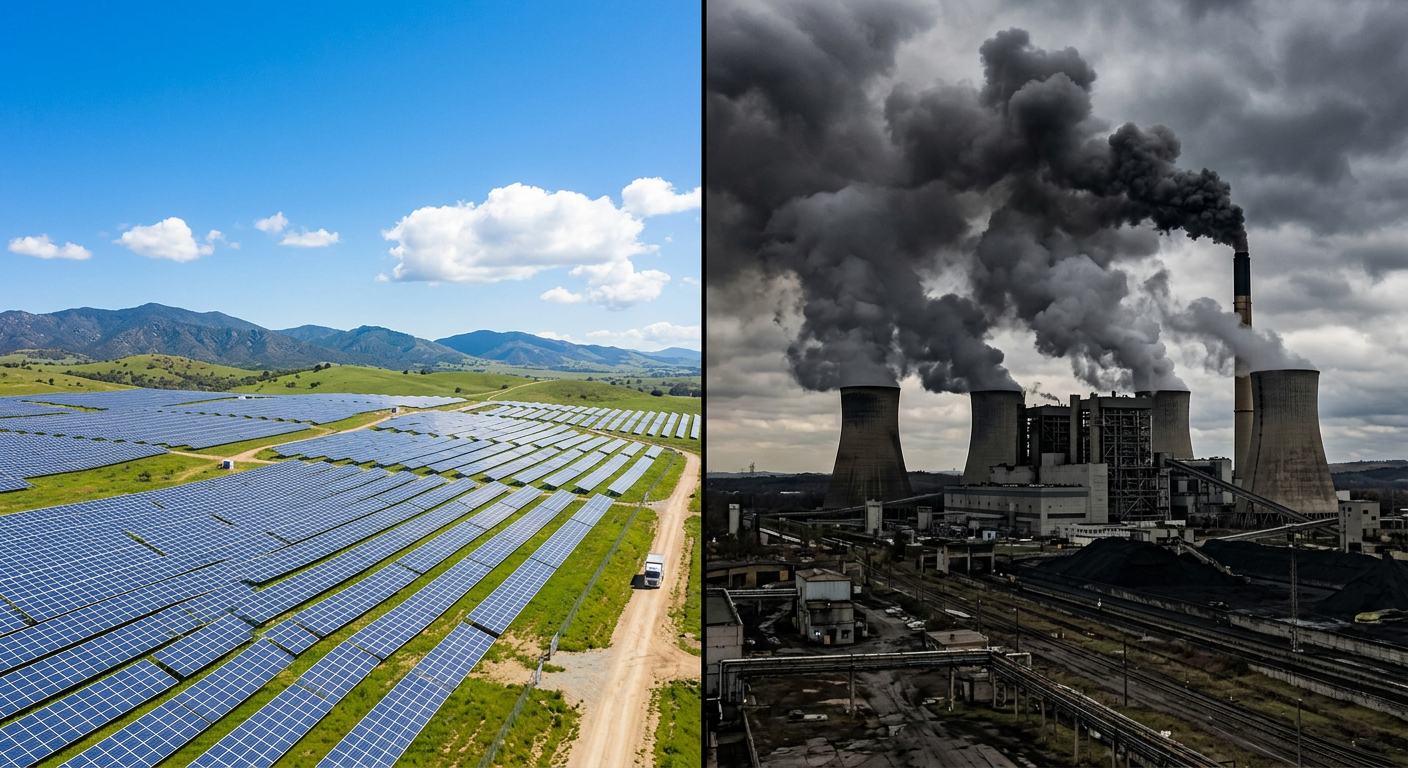
Comparison to Fossil Fuels
To put solar's lifecycle emissions in perspective, here are the lifecycle carbon emissions per kWh for various electricity sources (including manufacturing, fuel extraction, operation, and decommissioning):
| Energy Source | Lifecycle Emissions (g CO2/kWh) |
|---|---|
| Coal | 820-1,200 |
| Natural Gas (combined cycle) | 410-520 |
| Natural Gas (peaker plant) | 550-750 |
| Solar PV (utility-scale) | 20-50 |
| Solar PV (residential rooftop) | 30-65 |
| Wind (onshore) | 7-15 |
| Nuclear | 5-20 |
| Hydroelectric | 4-30 |
Solar's lifecycle emissions are approximately 10 to 40 times lower than natural gas and 20 to 50 times lower than coal. Even accounting for every gram of manufacturing carbon, solar is one of the lowest-emission electricity sources available.
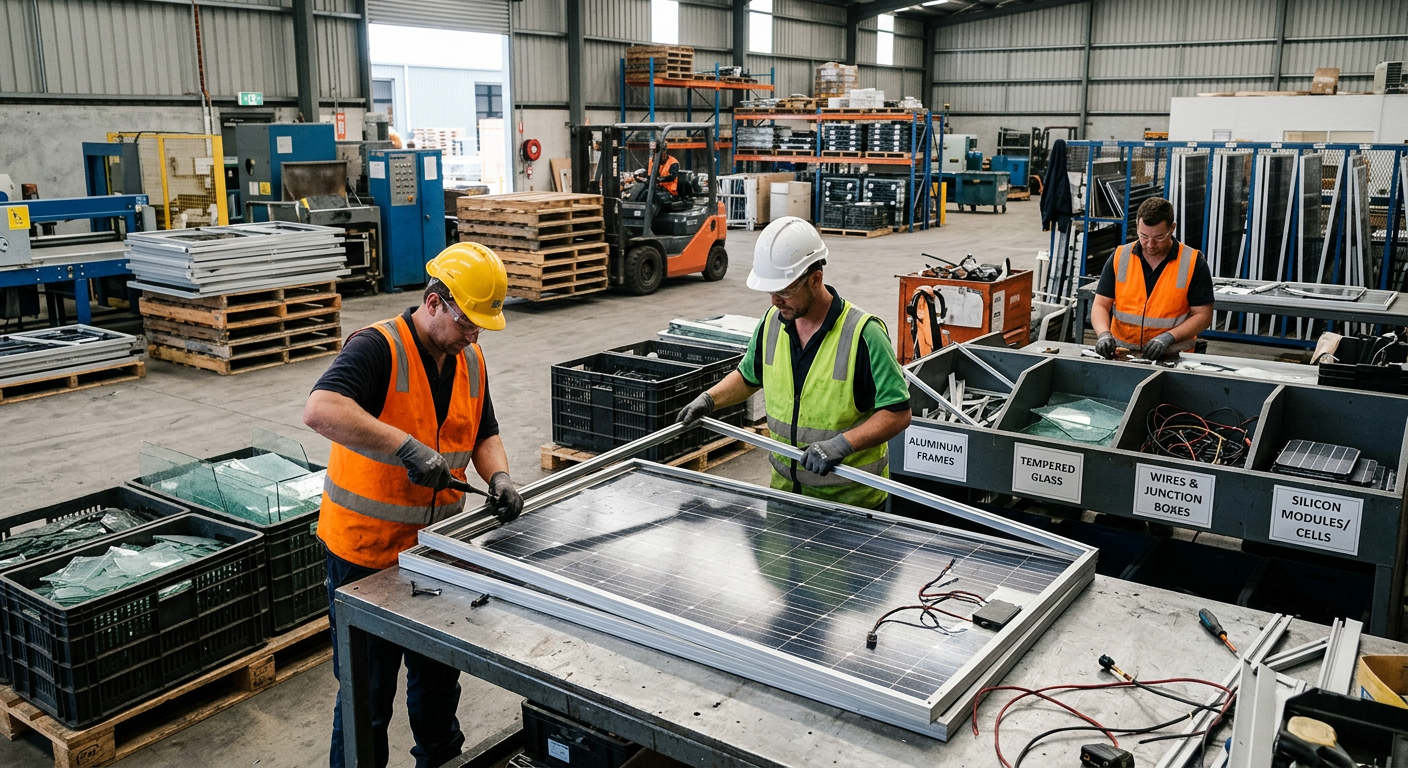
Stage 7: End of Life and Recycling
After 25 to 35 years of operation, solar panels are decommissioned. What happens to them matters for the complete lifecycle analysis.
Current Recycling Capabilities
Solar panels are approximately 80 percent glass and aluminum by weight — both of which are readily recyclable with existing infrastructure. The remaining 20 percent includes silicon cells, copper wiring, silver contacts, and plastic backsheets.
Current recycling processes recover 95 percent or more of the glass and aluminum and 85 to 95 percent of the semiconductor materials. Solar panel recycling infrastructure is growing rapidly, driven by the first wave of panels reaching end of life and by regulatory requirements in the EU and several US states.
End-of-Life Carbon Impact
Recycling solar panels generates a small carbon footprint (transportation to recycling facilities, energy for processing) estimated at 10 to 30 kg CO2 per panel. However, the recovered materials avoid the need to mine and process virgin materials for new panels, creating a carbon credit of 50 to 150 kg CO2 per panel.
Net end-of-life impact: carbon-negative (recycling saves more carbon than it emits).
The Improving Trajectory
Solar's carbon footprint has been declining dramatically and will continue to do so:
Manufacturing improvements:
- Thinner wafers require less silicon (150 micrometers today versus 300 micrometers in 2005)
- Higher cell efficiency means fewer panels needed per kW
- Cleaner manufacturing energy as factory grids decarbonize
- Silver reduction and replacement with copper and aluminum contacts
Longer operational life:
- Modern panels are warrantied for 25 to 30 years with expected useful life of 35 to 40 years
- Lower degradation rates (0.25 to 0.35 percent per year) mean more lifetime energy production
- Panel lifespan continues to extend with improved materials
Better recycling:
- Closed-loop recycling will recover nearly 100 percent of materials
- Design-for-recycling standards are being adopted by major manufacturers
- Recovered silicon can be re-purified for new panels at a fraction of the energy cost
By 2030, analysts project solar panel lifecycle emissions will fall below 15 g CO2/kWh — approaching the lifecycle emissions of wind and hydroelectric power.
What This Means for Your Decision
If environmental impact is part of your motivation for going solar, the data is unambiguous. Solar panels in Colorado repay their entire carbon footprint within two years and then deliver 25 or more years of clean, carbon-free electricity. Over its lifetime, a typical residential solar system prevents the emission of 80 to 120 metric tons of CO2 — equivalent to planting 2,000 to 3,000 trees or taking two cars off the road permanently.
The manufacturing carbon footprint of solar panels is not zero, but it is tiny compared to the carbon savings they deliver. And it is getting smaller every year.
Power Your Home, Protect the Planet
Every solar system installed in Colorado makes a meaningful difference in reducing carbon emissions. At ProGreen Solar, we help you maximize both the financial and environmental returns of your investment.
Use our solar calculator to see how much CO2 your solar system would prevent, or call us at (303) 484-1410 to discuss how solar fits into your sustainability goals. The math is clear: solar is one of the most impactful actions any individual can take to reduce their carbon footprint.