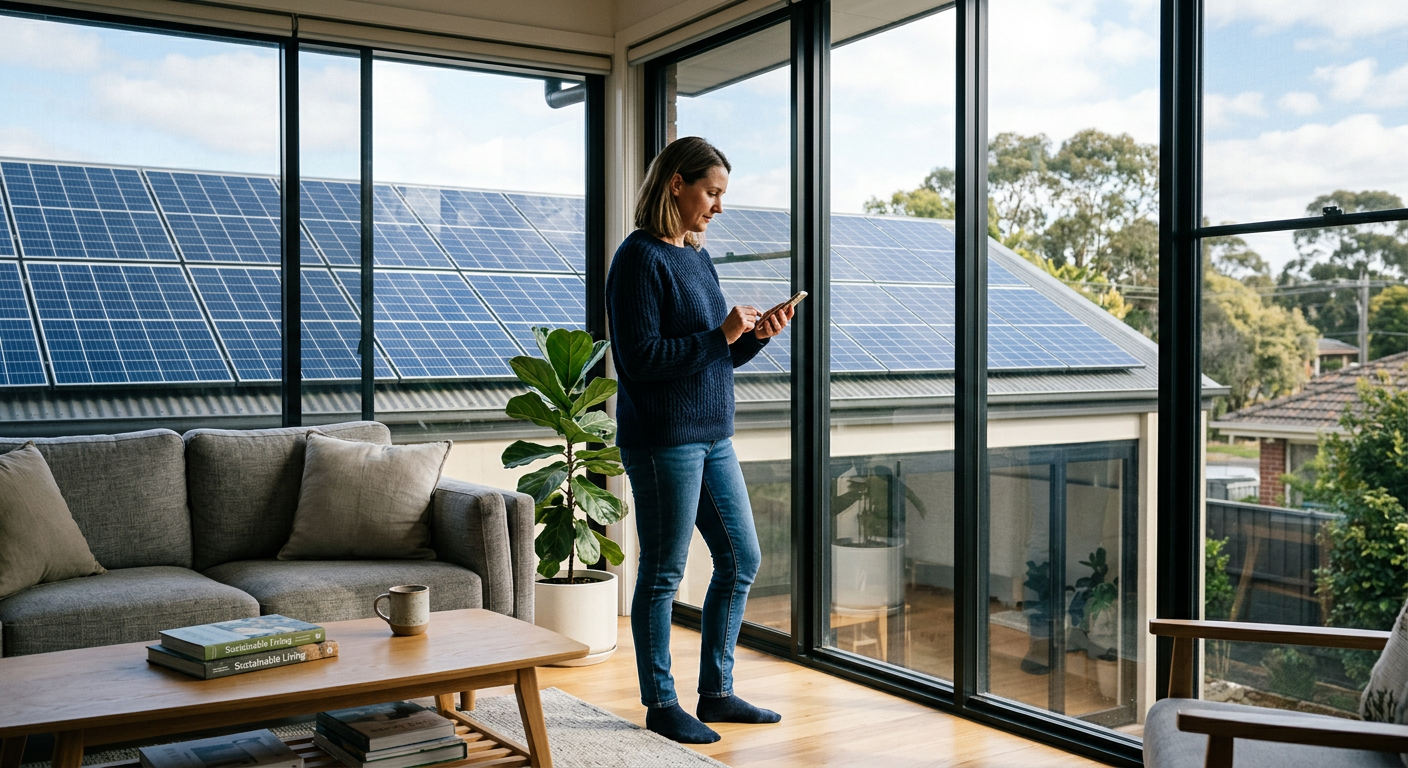
One of the most satisfying aspects of owning solar panels is watching them generate electricity in real time. But monitoring is not just for entertainment — it is a critical tool for protecting your investment. Effective monitoring helps you detect performance issues early, verify your system is producing as expected, optimize your energy usage, and provide data for warranty claims if needed.
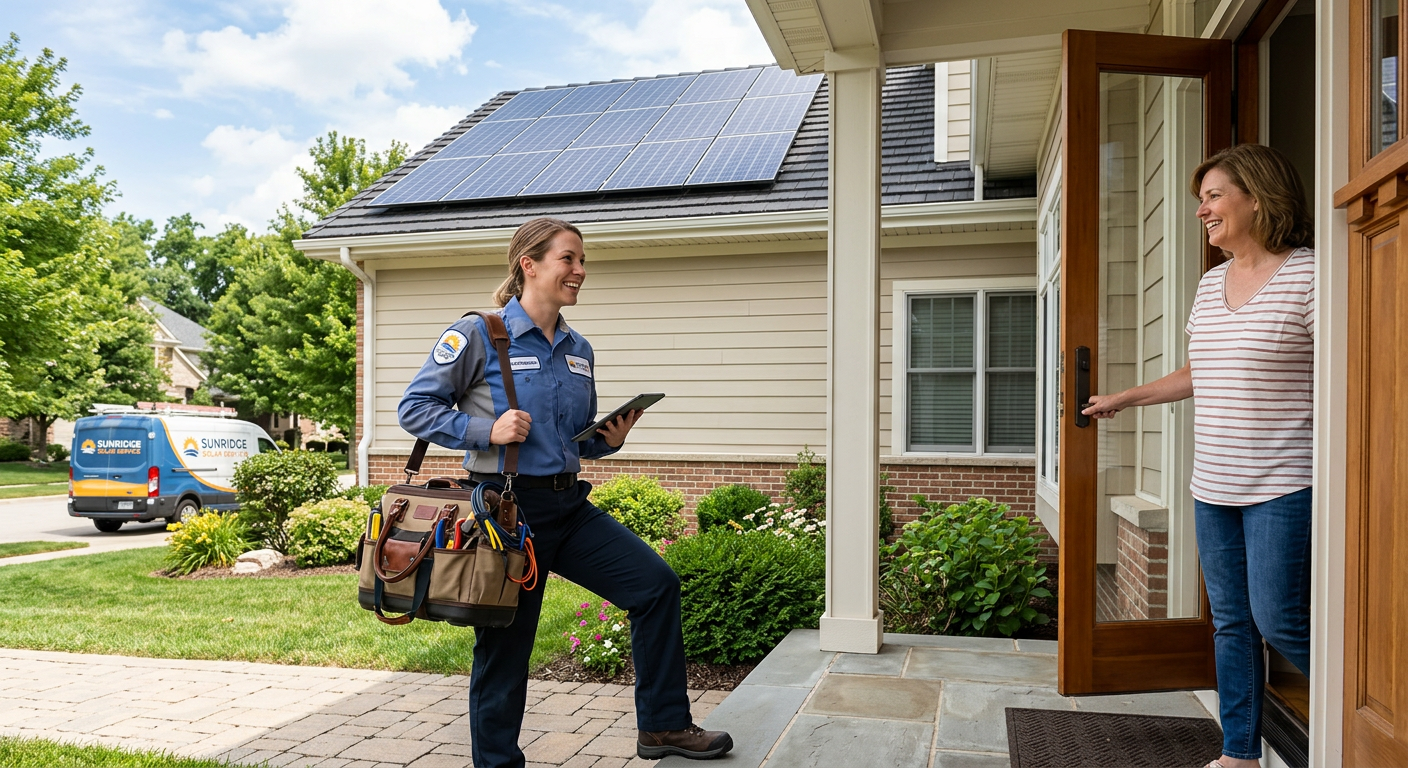
Every solar system ProGreen Solar installs includes comprehensive monitoring — it is not an optional upgrade, it is a fundamental part of a well-designed system. This guide covers the monitoring platforms available for the three major equipment ecosystems we install, what metrics to watch, and how to spot problems before they affect your bottom line.
Why Monitoring Matters
Without monitoring, you would not know your system has a problem until you receive an unexpectedly high electricity bill — potentially months after the issue began. With monitoring, you can detect issues within hours or days and take corrective action before significant production is lost.
Here are real scenarios from our customer base where monitoring paid off:
-
Microinverter failure detected within 24 hours. A single Enphase microinverter stopped reporting production. The customer was alerted via the app, and we replaced it under warranty within a week. Without monitoring, the lost production from that one panel ($20 to $30 per month) would have gone unnoticed for months.
-
Shading from a growing tree identified. A customer noticed one panel consistently underperforming in the afternoon. Panel-level monitoring showed the pattern clearly. Trimming a growing tree branch restored full production.
-
Soiling impact quantified. After cleaning panels, a customer documented a 12 percent production increase in the monitoring app — confirming the value of regular panel cleaning.
Enphase Enlighten Monitoring
If your system uses Enphase microinverters, your monitoring platform is Enphase Enlighten — available as both a mobile app and web portal.
What Enlighten Shows
System overview: Total energy production today, this week, this month, this year, and lifetime. Real-time production in watts, updated every 15 minutes.
Panel-level production: This is Enphase's biggest advantage. Because each panel has its own microinverter, Enlighten shows production data for every individual panel in your array. You can see exactly which panels are producing the most and which are underperforming.
Consumption monitoring (with CT clamps): If consumption monitoring was installed (standard with ProGreen Solar), Enlighten shows your home's total electricity consumption alongside solar production. This reveals how much solar energy you are self-consuming versus exporting to the grid.
Battery status (with IQ Battery): If you have an Enphase IQ Battery, the app shows battery charge level, charging and discharging power, and the energy flow between solar, battery, home, and grid in real time.
Environmental impact: Lifetime CO2 offset, equivalent trees planted, and other environmental metrics — useful for understanding your carbon impact.
Key Metrics to Watch
Daily production pattern. A healthy system shows a smooth bell curve peaking at solar noon. Irregularities — flat tops, early drop-offs, jagged production — may indicate issues.
Panel-level comparison. All panels in the same orientation should produce within 5 to 10 percent of each other. If one panel consistently produces 15 percent or more less than its neighbors, investigate.
Month-over-month comparison. Compare current month production to the same month in previous years. Production should be within 10 to 15 percent of the prior year (accounting for weather variation and normal panel degradation of about 0.3 to 0.5 percent per year).
Alerts and notifications. Enlighten sends email and app notifications for microinverter communication issues, production anomalies, and system offline events. Ensure your notification settings are enabled.
Enlighten Pro Tip
Use the "Array Layout" view to see a color-coded heatmap of your panel array. Green panels are producing at full capacity. Yellow panels are slightly underperforming. Red panels need attention. This visual makes it easy to spot issues at a glance.
SolarEdge Monitoring
If your system uses SolarEdge inverters with power optimizers, the SolarEdge monitoring platform provides comprehensive system visibility.
What SolarEdge Shows
System dashboard: Real-time production, daily energy, current power, and lifetime production. The dashboard provides an intuitive overview of system health.
Panel-level optimization data: SolarEdge power optimizers report individual panel performance, though with slightly less granularity than Enphase microinverters. Each optimizer reports its output power, voltage, and current.
Inverter performance: Detailed inverter metrics including AC output, DC input, conversion efficiency, and temperature. This data helps identify inverter-level issues that panel-level monitoring alone would not reveal.
Energy flow visualization: Real-time visualization of energy flowing between solar panels, inverter, home loads, battery (if applicable), and the grid.
Layout designer view: Physical panel layout with color-coded performance indicators — similar to Enphase's array layout but with optimizer-level data.
Key Metrics to Watch
Inverter efficiency. A healthy SolarEdge inverter operates at 96 to 99 percent efficiency. Sustained efficiency below 95 percent may indicate an issue.
Optimizer performance ratio. Compare each optimizer's output to the expected production for its panel location. Consistently low performers warrant investigation.
String voltage. If you have string-level monitoring, watch for voltage imbalances between strings. A string with significantly lower voltage may have a connection issue or underperforming panel.
Error codes. SolarEdge reports specific error codes through the monitoring platform. Common codes include ground faults, arc faults, grid voltage issues, and temperature warnings. Most errors resolve automatically; persistent errors require professional attention.
Tesla Monitoring
If your system includes Tesla solar panels or Powerwall, the Tesla app serves as your monitoring platform.
What the Tesla App Shows
Energy flow animation: The Tesla app's signature feature is an animated energy flow diagram showing real-time power moving between solar, Powerwall, home, and grid. It is visually engaging and immediately intuitive.
Solar production: Current power in watts and historical production in kWh for today, week, month, year, and lifetime.
Powerwall status: Battery charge percentage, power in/out, and operating mode (Self-Powered, Time-Based Control, Backup Only, Storm Watch).
Grid interaction: Real-time grid import/export power and historical grid usage.
Storm Watch: Tesla monitors weather forecasts and automatically charges Powerwall to full capacity before storms with potential power outages. You will see a notification when Storm Watch activates.
Key Metrics to Watch
Self-consumption rate. The Tesla app shows what percentage of your solar production you use directly versus export. Higher self-consumption means more value per solar kWh. If self-consumption is low, consider adjusting appliance schedules or Powerwall settings.
Grid independence. Tesla tracks the percentage of your home's energy that comes from solar and Powerwall versus the grid. Many Colorado customers achieve 80 to 95 percent grid independence.
Powerwall cycling. Monitor how often and how deeply your Powerwall cycles. Excessive cycling (multiple full charge/discharge cycles per day) may indicate system sizing or configuration issues.
Third-Party Monitoring Tools
Beyond your inverter manufacturer's platform, several third-party tools can enhance your monitoring:
Sense Energy Monitor
- What it does: Machine learning-based device identification that tells you which specific appliances are consuming power and when
- Cost: $300
- Best for: Understanding where your energy goes and identifying waste
- Complements: Any inverter platform — Sense focuses on consumption while your inverter platform tracks production
Emporia Vue
- What it does: Circuit-level energy monitoring for up to 16 individual circuits
- Cost: $100-$200
- Best for: Monitoring specific circuits (EV charger, HVAC, pool pump) to optimize scheduling with solar production
- Complements: Any inverter platform
Home Assistant
- What it does: Open-source home automation platform that integrates data from multiple sources (solar, battery, smart home devices, utility rates) into a unified dashboard
- Cost: Free software (requires a hub or runs on various hardware)
- Best for: Tech-savvy homeowners who want custom dashboards, automations, and data analysis
- Complements: Integrates with Enphase, SolarEdge, Tesla, and most smart home devices
Reading Your Monitoring Data
Daily Production Patterns
A healthy system produces a symmetrical bell-shaped curve centered on solar noon. Here is what deviations indicate:
Early morning drop or late start: Possible shading from trees or structures to the east. Monitor seasonally — shading may only occur during low-sun-angle months.
Afternoon cliff: Shading from the west, or panels facing east that naturally produce less in the afternoon.
Midday dip: An obstruction (vent pipe, chimney) casting a shadow across the array during peak hours. This should have been avoided during design, but tree growth can create new shading.
Jagged or erratic production: Cloud cover causes rapid production changes as clouds pass. This is normal on partly cloudy days. A persistently jagged pattern on clear days may indicate a wiring or inverter issue.
Flat-top curve: The system is hitting its maximum output (clipped by inverter capacity). This occurs when the DC array capacity exceeds the inverter AC capacity — typically by design, as moderate clipping is normal and intentional.
Seasonal Expectations
Colorado solar production varies significantly by season:
| Month | Relative Production | Notes |
|---|---|---|
| January | 60-70% | Short days, low sun angle, occasional snow cover |
| February | 70-80% | Improving sun angle, snow usually clears quickly |
| March | 85-95% | Rapidly improving production |
| April | 95-105% | Near peak, some pollen buildup |
| May | 100-110% | Peak month, long days, high sun angle |
| June | 100-110% | Peak month, longest days |
| July | 95-105% | High production, monsoon clouds reduce afternoon output |
| August | 90-100% | Monsoon season continues |
| September | 85-95% | Still strong, declining day length |
| October | 70-80% | Declining sun angle |
| November | 55-65% | Short days, low angle |
| December | 50-60% | Shortest days, lowest angle |
(100% = your system's rated average monthly production)
If your actual production deviates significantly from these patterns — especially during peak months — investigate potential issues.
Year-Over-Year Comparison
The most reliable way to assess system health is comparing current production to the same period in previous years. Account for:
- Weather variation: Cloudy years produce less. Check local weather data if production seems low.
- Panel degradation: Expect 0.3 to 0.5 percent annual production decline. Over 5 years, this is 1.5 to 2.5 percent — measurable but modest.
- Equipment changes: If you added panels, replaced an inverter, or trimmed trees, expect production changes.
A sudden drop of more than 10 percent year-over-year that is not explained by weather warrants investigation.
Setting Up Alerts
All major monitoring platforms support configurable alerts. At minimum, enable:
- System offline alerts — Notifies you if the monitoring system loses communication (which may indicate an inverter shutdown or internet issue)
- Production anomaly alerts — Notifies you if daily production is significantly below expected levels
- Error/fault alerts — Notifies you of specific equipment errors
- Battery alerts (if applicable) — Low battery, charge failure, or temperature warnings
Check your monitoring platform's settings to ensure email and/or push notifications are enabled. ProGreen Solar configures these during installation, but verify they are working by checking that you receive occasional status updates.
When to Act on Monitoring Data
Not every anomaly requires action. Here is a decision framework:
Investigate within a day: System completely offline, zero production on a sunny day, multiple error alerts.
Investigate within a week: Single panel consistently underperforming by more than 20 percent, inverter efficiency consistently below 95 percent, unexplained production decline.
Investigate at next scheduled maintenance: Minor production variations (5 to 10 percent between panels), seasonal patterns you want to understand, soiling that is not severe.
No action needed: Normal daily and seasonal variation, brief production dips during cloudy periods, short-duration communication dropouts that resolve automatically.
For issues that require professional attention, see our guide on common solar panel problems and when to call a solar professional.
Your Monitoring Dashboard Awaits
Monitoring transforms solar ownership from a passive investment into an engaging, optimized energy management experience. Whether you check your app daily or review monthly reports, the data empowers you to maximize your system's production and protect your investment.
If you are not yet a solar owner, use our solar calculator to explore what a monitored, optimized solar system could do for your home. Or call ProGreen Solar at (303) 484-1410 — we will set you up with a system that includes comprehensive monitoring from day one.